A while ago I was conducting a meta-analysis on diachronic variation in cranial volume measurements for different East Asian populations. I got into the project after being inspired by Lynn’s suggestion that the Flynn Effect is primarily nutritional, as presumably this would also show an effect on height, head size, and thus ICV. It could even be possible to control for ICV changes to show only the direct change to IQ over time, which would be a more rigorous way to compare Flynn Effect magnitudes. What a great idea, I thought.
Unfortunately as I got deeper into the project, I realized that virtually all of my data couldn’t be sourced back to any obtainable research. A lot of numbers were sourced from papers that were only available in physical archives in Japan or Korea, so I did what any good researcher does and promptly gave up.
However, even with the limit to my data integrity acknowledged, I was still able to get some plots of the cranial volume measurements that show some interesting results. Here’s a scatterplot I built using values from all studies I could find; the x-axis shows the year of the study’s publication and not the date of subject collection, expiry, or measurement. Note that all datapoints are n-unweighted (raw averages).
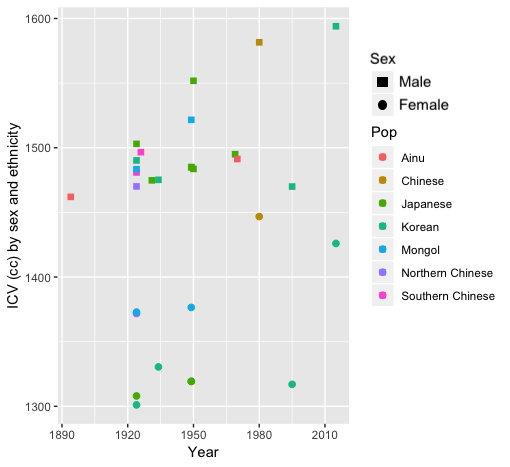
While initially there doesn’t seem to be much to say about this graph, it’s noteworthy that there don’t appear to be (when plotted in this form) any outliers, but two relatively clear clusters by gender. Clearly the female cluster is far less grouped than the male one (the source of its statistical insignificance that can be clearly seen in the following trendlines) but both clusters have mutually exclusive ranges, which are interesting. Since all of the studies here had sample sizes that were above 20 we’d expect distributions to be roughly normal, meaning that group-level sex differences in ICV are likely very reliable. This of course is no surprise seeing as ICV is effectively a function of body size and height, which are also variant with respect to sex in the same way. This becomes more obvious when we ignore the insignificant ethnic variation and go purely to the sex differences:
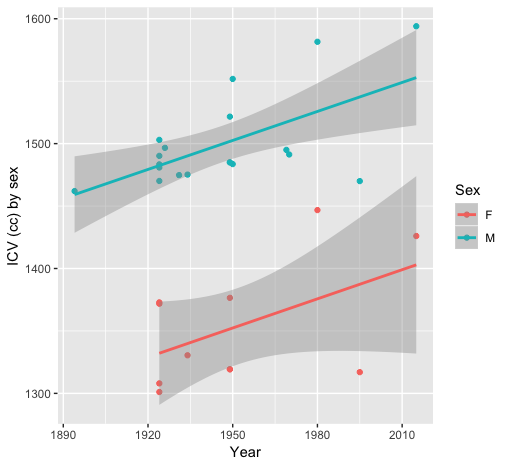
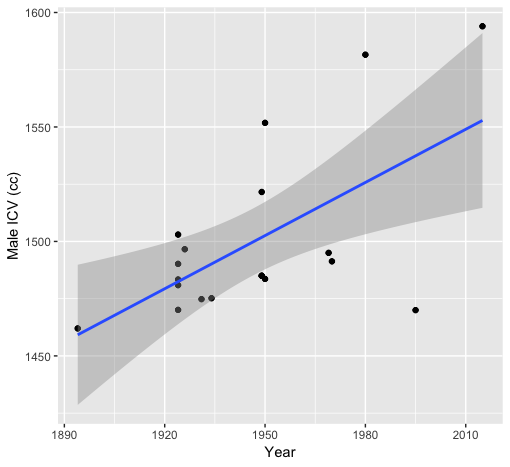
Overall it is fairly clear that ICV as reported in studies is increasing overtime. However, note the lack of any female reports going back beyond the early 1920s? This is a sign that our data is shitty. For many of the earlier studies no sex information was present, and although in some cases I was able to make informed estimates based on the averagees (i.e. a mean ICV value close to 1500 is almost certainly male or mostly male in content) it was never really certain how accurate or representative the values might be. However, if we are correct in inferring that earlier studies likely did not disambiguate male and female samples (as opposed to exclusively using male samples) then it could be suggested that the actual observed gap would be even greater, seeing as the female values would go down and the male ones would go up. This of course would throw the trendline for diachronic variation into doubt, which is currently strong with p value < 0.05 when excluding females.
Email me if you want the full dataset to work on.